Dr. James Hansen
- Details
- Category: Dr. James Hansen Dr. James Hansen
- Published: 31 March 2015 31 March 2015
For now I want to let people living in the eastern two-thirds of North America know that global warming is really happening. In fact, 2015 should be the year that stifles discussion of a warming hiatus. A substantial developing El Nino will add to the global warming trend, and should make 2015 easily the warmest year in the instrumental record.
However, you don’t live on the global average. Global maps of temperature anomalies (Fig. 1) let you see how anomalous the temperature was at any place in January and February this year, and the annual anomaly for 2014. East of the Rockies was remarkably cold in February, and 2014 as a whole had a similar temperature anomaly pattern.
We wondered about possible relation of temperature patterns with the “global warming hole” in the North Atlantic south of Greenland, noted in the scientific literature by Drijfhout et al. (2012). Rahmstorf et al. (2015) note that this warming hole, at least on longer time scales, is probably related to a slowdown in ocean heat transport. In climate simulations with increasing meltwater from Greenland we have noted a cooling in that area and a tendency for atmospheric blocking there, which provides another hypothesis to account for a fixed location of Arctic cold air outbreaks. More about that later.
You can take consolation in realizing that it really was as cold as it seemed. Unless you are more than 80 years old, February was the coldest February of your life in New York City (Fig. 2a). In fact, it was the 2nd coldest month in the past 80 years, only January 1977 being colder.
Fig. 2(b) is to remind you that local temperature anomalies dwarf global anomalies. So why do we care about global anomalies that are much smaller than local natural variability? A lot of reasons, but our next paper will, I think, make that story clearer.
Wait a minute! Does this large local “noise” mean that we have a good chance for a cooler than average summer? Eh, not so much. First, summers are much less noisy than winters – for good reasons, such as the much weaker equator to pole temperature gradient in the summer. Think of the “bell curve” for summer temperature anomalies (Hansen et al. 2012) – the summer bell curve has shifted far to the right. Waggles in the jet stream – largely unforced, i.e., natural variability – that affect regional climate are important in the summer, as well as in other seasons, but chances of having a summer warmer than it was several decades ago are high. And thus so too are the extreme events embedded within a hotter than normal summer.
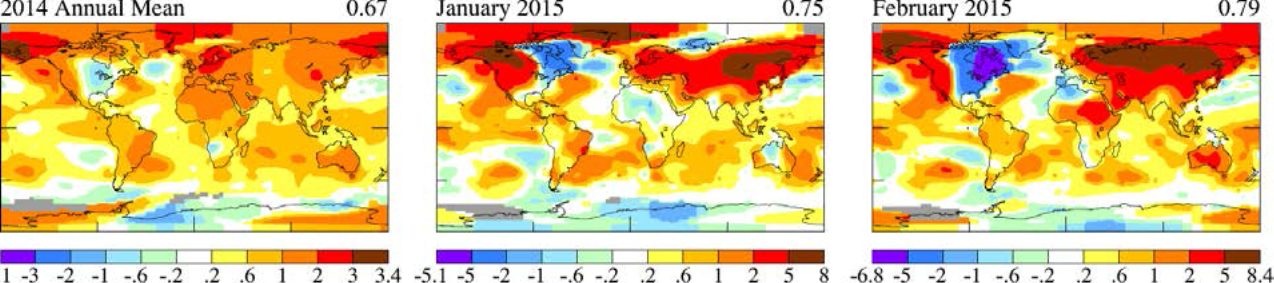
Fig. 1. Annual 2014 and January and February 2015 surface temperature anomalies relative to 1951-1980.
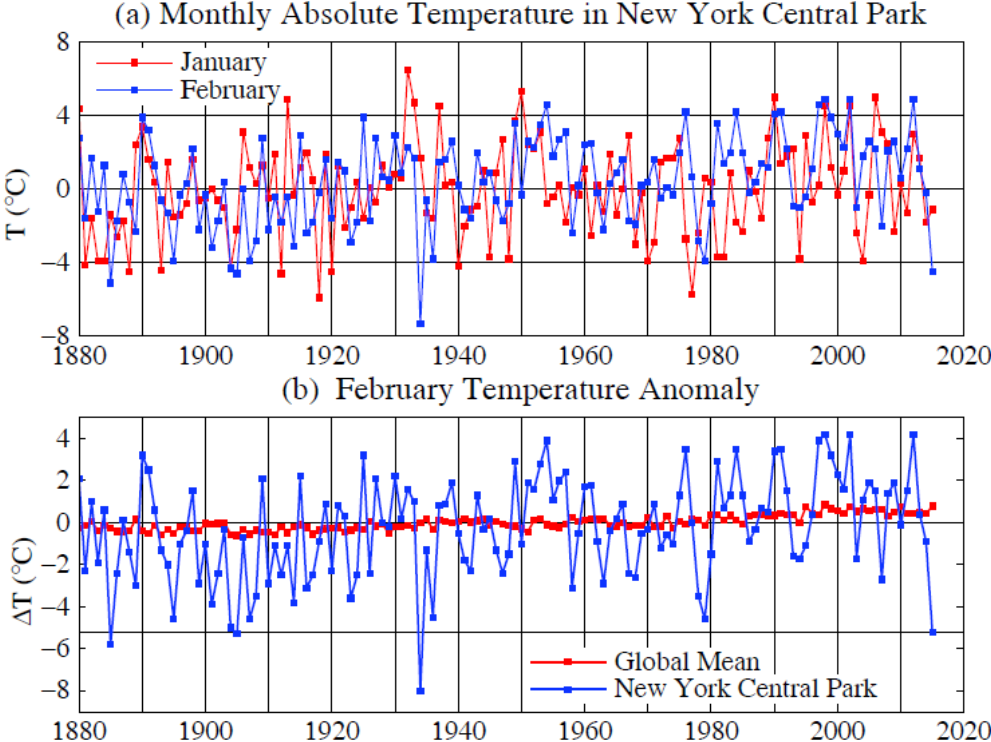
Fig. 2. (a) January and February monthly mean temperature in New York City, (b) comparison of global and New York City February temperature anomalies during 1880-2015.
These graphs are a sample of figures that Makiko Sato updates every month and makes available on one of our web sites (http://www.columbia.edu/~mhs119/Temperature/). The “More Figures” link at the bottom of that page provides more maps and graphs. You can sign up to receive an e-mail notification when the monthly update becomes available on the home page of Climate Science, Awareness and Solutions. The monthly global map helps to make clear how the global situation is developing and how your location fits into that global picture.
References
Drijfhout, S., Oldenborgh, G.J. and Cimatoribus, A.: Is a decline of AMOC causing the warming hole above the North Atlantic in observed and modeled warming patterns?, J. Climate, 25, 8373-8379, 2012.
Hansen, J., M. Sato, and R. Ruedy, 2012: Perception of climate change. Proc. Natl. Acad. Sci., 109, 14726-14727, E2415-E2423, doi:10.1073/pnas.1205276109. See also Communications on 3 Aug. 2012: "New Climate Dice" paper to be published under another name, and 11 Aug. 2012: Increasing Climate Extremes and "The New Climate Dice".
Rahmstrof, S., Box, J.E., Feulner, G., Mann, M.E., Robinson, A., Rutherford, S., and Schaffernicht, E.J.: Exceptional twentieth-century slowdown in Atlantic Ocean Overturning circulation, Nature Clim. Change, publ. online 23 March doi:10.1038/NCLIMATE2554, 2015.